

DAO Research
Regime-Switching Strategy
Update I - 22/07/2023
View on Gitbook:


INDEX
Preface
I. Defining bull market and bear market in literature
II. A methodology for defining bull and bear markets by Chuck Dukas
III. Strategy semantics: Setup
IV. Strategy semantics: Exit Strategy
V. RSI
VI. 2 Line Moving Average
VII. Breakeven Stop Order, Stop Loss
VIII. References
IX. Download of the ESL strategy code
Preface
This strategy was researched by the Gorn DAO management team and the Gorn community with the aim to incorporate the market cycle/phase strategy into the Gorn treasury. Market phase strategies focus on long term trading systems that trade bull and bear markets with the use of technical anlaysis. This specific market phase strategy focuses on only going LONG in a bull market and exiting when a bear market starts. It was incepted by Chuck Dukas. The exit strategy research for this trading idea was developed by the Gorn Hegemony DAO. The strategy backesting research was run on Tradestation platform using EasyLanguage (ESL) coding. The strategy will trade the SP500 ETF with the symbol SPY. At this point I want to thank all our members, followers and team for supporting and providing. The Gorn DAO has the aim to establish a knowledge foundation of short term and long term trading strategies as well as develop frameworks for implementation, operation and continuous improvement of the Gorn trading systems.
Defining bull market and bear market in literature
Defining and dating bull and bear markets is a crucial aspect of financial analysis and investment decision-making. Accurate identification of these market phases is essential for understanding market trends, managing risk, and formulating effective investment strategies. Research delves into the historical evidence and methodologies used to define and date bull and bear markets over the past two centuries.
Throughout the years, researchers and traders have proposed various definitions and methods to classify market phases. Bull markets are typically characterized by a sustained upward trend in stock prices, investor optimism, and positive economic indicators. On the other hand, bear markets are marked by declining stock prices, pessimism, and negative economic conditions. However, precisely defining the beginning and end of these phases is a complex task.
How traders identify bull market and bear market phases
One common approach to dating bull and bear markets is based on percentage price changes. For instance, a commonly used threshold is a 20% decline in stock prices to define the start of a bear market, while a 20% increase signals the beginning of a bull market. However, this method has limitations, as it relies solely on price movements and fails to capture other relevant factors such as investor sentiment or economic fundamentals.
Another approach involves using economic indicators to identify market phases. Researchers often consider variables such as GDP growth, unemployment rates, and corporate earnings to determine the state of the economy and its impact on stock markets. By analysing these indicators alongside price data, researchers can gain a more comprehensive understanding of bull and bear markets.
The research paper by Gonzalez et al. referenced various methodologies used to date bull and bear markets over a two-century period. It might explore how different criteria and indicators have evolved over time and assess the accuracy of these methodologies in capturing market cycles and turning points. The authors may also discuss any challenges or limitations associated with their chosen approach.
Additionally, the research paper may delve into the implications of accurately dating bull and bear markets for investors and policymakers. Understanding the timing and duration of market phases can aid in portfolio management, asset allocation decisions, and risk management strategies. Moreover, policymakers can benefit from such research by implementing appropriate measures to mitigate the negative impact of bear markets and leverage the positive effects of bull markets.
In conclusion, defining and dating bull and bear markets is a critical aspect of financial analysis and investment decision-making. The paper you mentioned likely provides a comprehensive review of the methodologies used to define and date these market phases over a two-century period. By examining historical evidence and evaluating different criteria, the authors likely aim to contribute to the understanding of market cycles and provide valuable insights for investors and policymakers (Gonzalez, 2006).
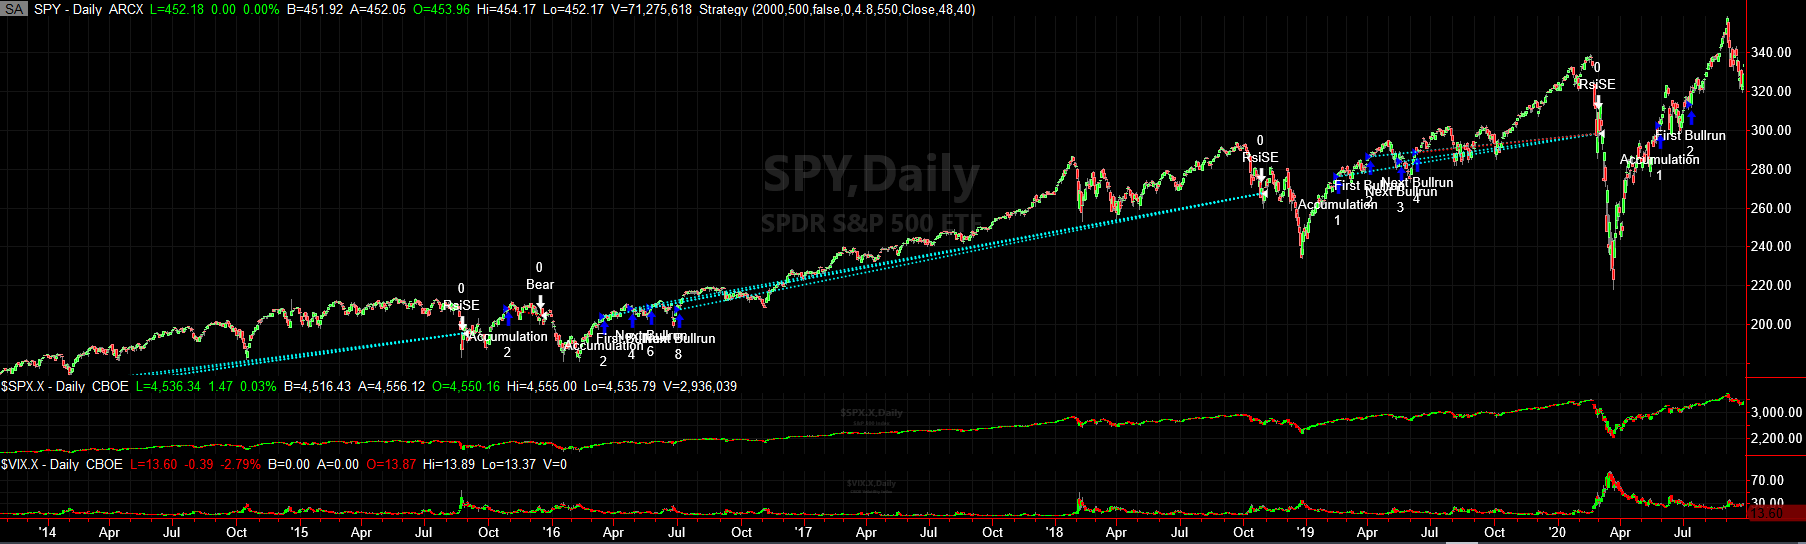
A methodology for defining bull and bear markets by Chuck Dukas

Chuck Dukas, a contributor to Stocks and Commodities magazine and trading strategy researcher, has put forth a method of defining bull and bear markets using moving averages. Moving averages are widely used in technical analysis to smooth out price data and identify trends. Dukas utilizes two moving averages to define these market phases.
In his approach, Dukas suggests using a shorter-term moving average, such as the 50-day moving average (50MA), and a longer-term moving average, such as the 200-day moving average (200MA). The crossing of these two moving averages serves as the basis for identifying bull and bear markets.
When the 50MA crosses above the 200MA, it indicates a bullish signal. This crossover suggests that the shorter-term trend is gaining strength and surpassing the longer-term trend, implying upward momentum in the market. This event is considered a bullish phase or the start of a bull market. Traders and investors may interpret this as a favorable time to buy or hold positions, as the market is expected to continue rising.
Conversely, when the 50MA crosses below the 200MA, it signifies a bearish signal. This crossover indicates that the shorter-term trend is weakening and falling below the longer-term trend, suggesting downward momentum in the market. This event is considered a bearish phase or the start of a bear market. Market participants may interpret this as a cautionary signal to sell or reduce holdings, as the market is expected to experience further declines.
By utilizing moving averages and their crossovers, Dukas provides a relatively simple method to define and identify bull and bear markets. This approach allows traders and investors to have a visual representation of the prevailing trend and make informed decisions based on the market's momentum. It provides a systematic framework for understanding market cycles and potentially capturing profitable opportunities or managing risk.
However, it is important to note that no single method can perfectly capture the complexities of financial markets. Different market conditions and factors can impact price movements, and relying solely on moving averages may not always be sufficient. It is advisable to combine this approach with other technical indicators, fundamental analysis, and market context to obtain a more comprehensive view of market conditions before making trading or investment decisions.

Strategy semantics: Setup
We will be applying this strategy on the daily chart of the SPY (SPDR SP500 ETF) with 23 years of price history.
Commission is set to 5 USD, Slippage 0.03 USD per round trip.
Required Capital to run the strategy will be 5000 USD (Position size = Risk/STOP LOSS).
Position size will be fixed at 500 USD per order. Pyramiding orders are activated for this strategy, thus up to 4 LONG (total of 2000 USD) entries are allowed during a full bull market cycle. Dukas market phase strategy goes LONG once at the beginning of a accumulation phase as well a total of 3 LONG entries during the full cycle of a bull market. Then it exits all position when the first phase of the Bear market emerges.
The next research steps are to identify the most profitable parameters of the strategy, seen in the next chart. "Decision" and "Entry" relates to market timing of when going LONG, which we already have in place in the market phase strategy. Target is the profit target of the strategy. Time will be set at the beginning of a daily candle. Profit target, Risk & Reward and Stop will be covered later on in this article.

The 6 dimensions of a trade
Strategy semantics: Exit strategy and target
The initial exit strategy of the market phase model is an EXIT of the LONG position when the first bear market phase happens (50 day moving average crosses under the 200 day moving average). Furthermore lets examine more exit strategies that could benefit the market phase strategy.
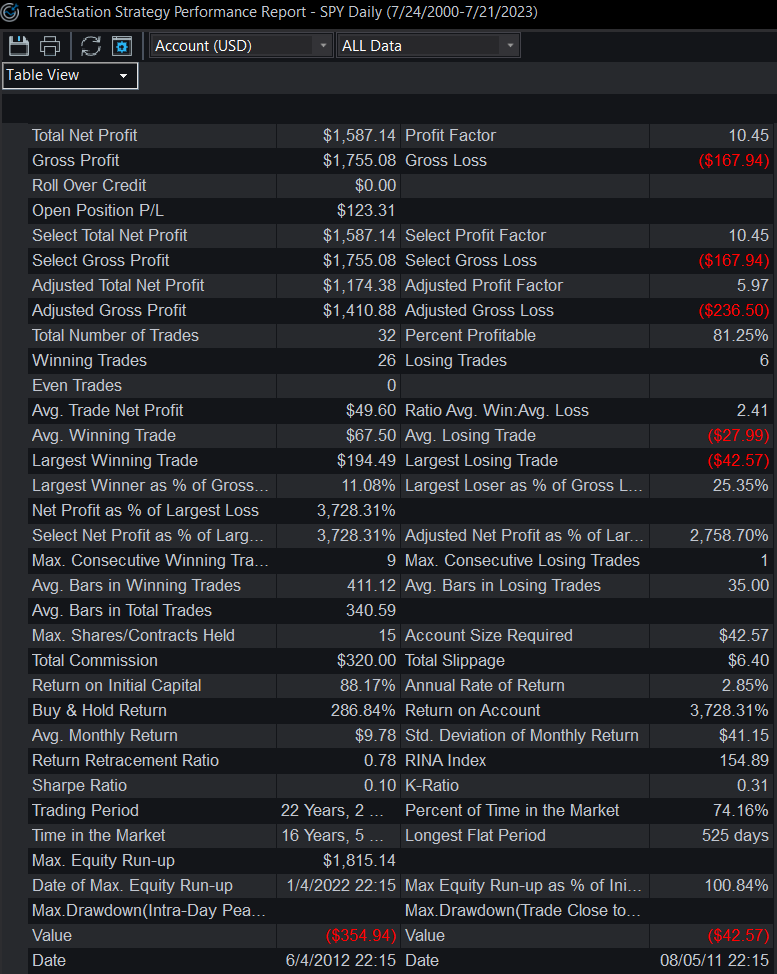
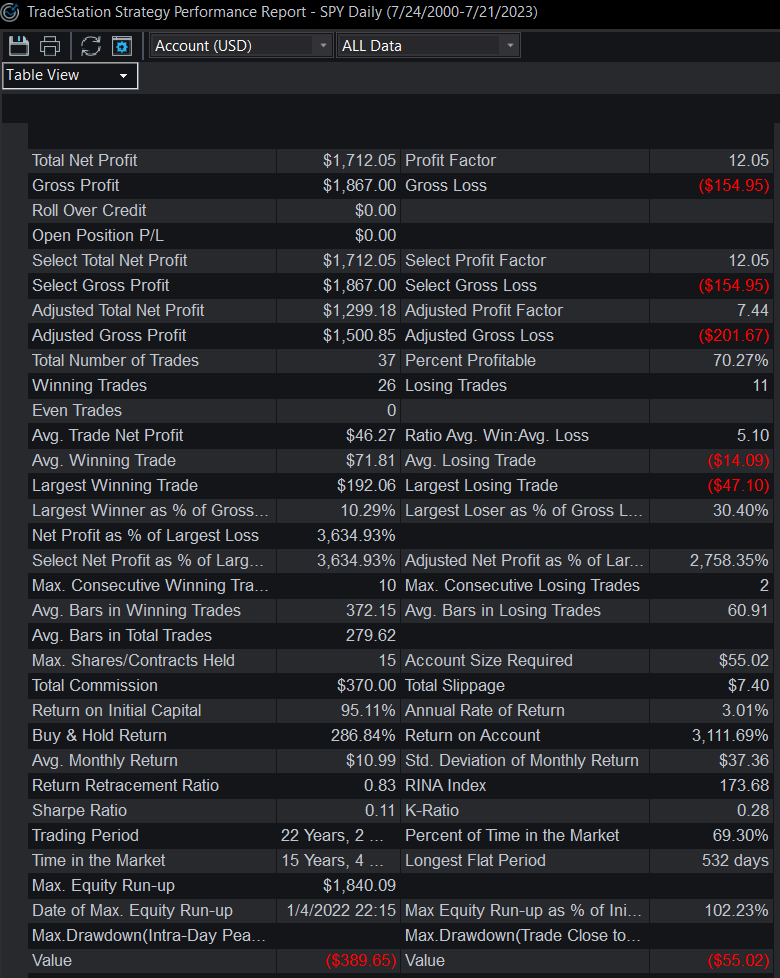
We compare all the different strategy permutations by looking at the Performance Report, seen below. Some important statistics of a strategy are Net Profit, risk/reward ratio (known as TS Index within Tradestation), drawdown, profit factor, and expectancy, whose formula is
Expectancy = (Probability of Win x Average Win amount) - (Probability of Loss x Average Loss amount)
In Tradestation it is possible to optimize with a fitness function, which we choose to be Total Net Profit.
Profit target will be set after we scrutinize the different exit strategies.
The Sharpe Ratio (Risk/Reward) will change depending on the exit strategy chosen. This ratio essentially compares the return and the risk of an asset, or in other words measure the risk adjusted return.
RSI
Our team has identified that a RSI Exit strategy can beneficial when applied to this trading idea. By applying a RSI SE (Short entry) that is only allowed to close open LONG position we improve the profitability of the strategy, as seen in the next picture. Specifically, we can observe that the RSI gives the strategy an edge to exit certain extreme bull markets or starting bear market more effectively.
Parameters are RSI LENGTH = 48, RSI OVERBOUGHT=40
RSI Exit Strategy applied
2 Line Moving Average Crossover
Our team has identfied that applying a 2 Line Moving Average Crossover can increase the profitability and number of trades compared to the the RSI Exit strategy, but it can be observed that there are instances where the 2 line moving average could prematurely exit a bull run, as seen in the picture below.
If you combine RSI Exit with this one you will end up with almost the same statistics as just using the 2 Line Mov. Avg. itself.
Parameters are SLOW LENGHT = 117.9, FAST LENGHT = 106.4. This parameters we optimized for the timeframe of 23 years, with the fitness function USD Dollar net porfit amount. (Which means this parameters yield the most profitable settings of the 2 line Mov. Avg. indicator when looking at the 23 years of price action history).
(In order to apply the same 2 line Mov Avg inside Tradingview use

Breakeven Stop Order, Stop Loss
Our team has identified that applying a Breakeven STOP order can be beneficial for this strategy. Therefor we use a custom made breakeven stop that triggers when the total LONG positions have accrued 150 USD, which is also known as THRESHOLD parameter. The next parameter is "targetv". TARGETV describes the amount of dollars the BREAKEVEN ORDER will be placed over your initial opening price of the LONG position. Threshold is the parameter that will trigger the initiation of the BREAKEVEN ORDER. If the threshold value is 150 it means that when the positions have a cumulative profit of 150 dollars, it will initiate the BREAKEVEN STOP ORDER. A BREAKEVEN STOP ORDER in place equates to a risk-free position, since the worst case scenario is that you exit the position at the OPENING PRICE + TARGETV which means you have a small profit.
The Stop-Loss of the strategy will be set at 150 USD.
Reference
1)Gonzalez, et al. Researchgate https://www.researchgate.net/publication/252815480_Defining_and_Dating_Bull_and_Bear_Markets_Two_Centuries_of_Evidence
Download of the ESL strategy code
Find the .ELD file (a strategy file format used inside Tradestation platform) from the Gorn DAO Discord under the category "trading-desk". Then open your Tradestation platform and double-click the .ELD file you have just download. TS will install the strategy and then you will have it inside the strategy list, named as GORN DAO MARKET CYCLE STRATEGY DAILY CANDLE. Be aware that when setting the strategy parameters (risk per trade aka position size, Account size) you can simply set the strategy preferences within Tradestation, that will circumvent the strategy parameters of the market cycle strategy module.